It is easy to say which team is the best at the end of a season: the one that wins the championship. However, pubs everywhere are often animated by occasionally heated discussions about who is the best player. On a more serious note, football organizations are always trying to reinforce their ranks with good players and decide which players are not good enough to stay in the team.
While front offices in today’s digital era likely have some objective criteria in evaluating players, the public does not seem to speak the language of analytics as much as American sports fans. They are therefore left to debate who is the best player for their fantasy team based on gut feelings.
This article will try to establish some more objective, yet digestible, performance metrics allowing player comparison across the English Premier League, though the analysis could be just as easily extended to other leagues.
Guiding principles
As seen here, there are many things the best teams do better than the others. However, possession and scoring efficiency are the most important parameters for a team that ends up higher in the table. While football is a complex sport, this simplistic approach does make sense: controlling the ball allows for the creation of more shooting chances while simultaneously taking chances away from the opponent. And, given a basic skill level to play in a specific league, shooting more is bound to produce more goals, albeit with varying efficiency. We can then argue that winning ball control is also very important as it actively takes away chances from the opponent.
With these considerations in mind, these are the elements necessary in building a player evaluation:
- Gaining ball control
- Maintaining ball control
- Shooting and scoring
The evaluation that follows is built on data extracted from fbref.com. While a lot of stats are available, a few core quantities that capture these three phases of play will be selected.
It is important to mention that different positions on the field are expected to cover different phases more (e.g. a forward might be expected to score more goals than a defender, who, in turn might be expected to gain control and pass the ball forward more). Therefore, when evaluating players, the position will be used to adjust stats ensuring comparison of like with like.
Finally, rate-type stats make for better comparisons between players, e.g. given a minimum number of tackles, a player with 100% tackling efficiency over 2 games in a season is not necessarily better than one with 80% efficiency over 25 games, so some cutoffs will be used to guarantee a fair comparison.
Gaining ball control
Gaining control is the start of every action. This can happen in many ways: an erratic pass from the opponent recovered by a player, a throw-in, a free kick, a tackle, an interception or pressure.
Throw-ins, interceptions and free kicks however are not caused by a player as much as by an opponent’s mistake. Besides, in the attempt to build rate stats, there is no data on comparison terms for these quantities like how many throw-ins were attempted and how many were intercepted, therefore they will not be considered for evaluation. There is data on pass reception percentage though and that will be considered in the possession section as no change in possession is actually happening when receiving a pass.
Tackling, pressures and aerial contrasts work well for assessing a player’s performance as fbref provides data on how many of these actions were attempted and how many were successful, so we can define the following:
Ball possession
Maintaining ball control is crucial to creating more shooting and, eventually, scoring opportunities. Fbref provides data on touches (defined as possessions where stopping the ball, carrying it and passing it counts as one touch), carries, dribbles, passes and passes received. While there is data on pass length, touch location, carry distance and progressive carries, it will not be used at this time as it goes more in the direction of defining a player’s style and positioning, which, once again, may not be a direct consequence of a player’s ability but rather a reflection of team strategy and opponent ability.
A player’s ability to maintain control will therefore be assessed in terms of the following quantities:
Shooting and scoring
Scoring is the objective of every team. The more goals, the greater the chances of winning.
In this case, there is data on shots taken, shots on target, goals per shot on target (scoring efficiency), shot-creating actions (last 2 offensive actions leading to a shot) and goal-creating actions (last 2 offensive actions leading to a goal). All this data is useful considering a player that doesn’t score himself or herself may still contribute via an assist, which is as important as a goal.
Combining shot- and goal-creating actions in a single metric can give a better idea of a player’s goal creation efficiency:
Goalkeeping
While it wasn’t one of the 3 pillars of player performance, nobody would ever say that the goalkeeper isn’t playing a crucial role on the pitch. Statistics for goalkeepers are simply too specific to be applied to the rest of the team.
While a goalkeeper brings intangibles like moving the defense or launching the team forward after a failed shot, it could be said that the key, measurable stat would be blocking the shots coming at him or her. This is measured by the saves percentage:
League leaders cutoff
As mentioned previously, rate-type stats are preferred in order to compare players. However, comparison between players that were on the pitch for every game and players who only played a couple of games could be extremely unfair given the small-sample fluctuations. To mitigate this, there is a double cutoff to consider league leaders in any metric.
First of all, a 40% game threshold is implemented. That is, when looking for the best players in any category a player must have been on the pitch for at least 40% of the total minutes played by the team to qualify, otherwise they are discarded from the computation of the mean. This threshold is somewhat arbitrary but based on the idea that the best players will be on the field as much as possible barring injury.
Secondly, given the rate-type stats, we can determine a cutoff by looking at the average amount of a particular action performed by a player in a specific role. For example, a defender may not be attempting that many dribbles, so two dribbles a season may be enough to qualify. A midfielder or a forward however may attempt more on average. This thinking can be applied to any metric shown in this post.
To compute this cutoff, we can consider that goalkeepers tend to be on the field more consistently than position players. Therefore, as many goalkeepers as there are teams should qualify for saves leaders. This is the case when keeping a cutoff at
On a first approximation, this was the cutoff used for any quantity: a player must have attempted half the average amount of any action for his position in order to qualify for league leader consideration in that category.
Nondimensional comparison
While the stats considered for comparison are rate-type and rather easy to compare, it would not be immediately obvious how good a player who dribbled past the opponents successfully 70% of the time really is. To make this more easily identifiable a 100-scaling is useful. This means taking each quantity used in assessing player performance, dividing it by its average over the league, season and player position and multiplying it by 100, making 100 the league average for each position and temporal sample considered. The higher over 100 a player is, the better they were compared to the league average in that position for that season.
As each of the main game phases is made of different stats, we can compute a global phase-score. Since everything has been nondimensionalized, we can take the average of the components, e.g:

The score will still be scaled to 100, giving the overall evaluation of a player on the control-gaining phase of the game.
League leaders
Now that everything has been defined, the best player for every role in each phase can be established. In table form, we can look at the overall leaders in gaining control, possession and scoring.
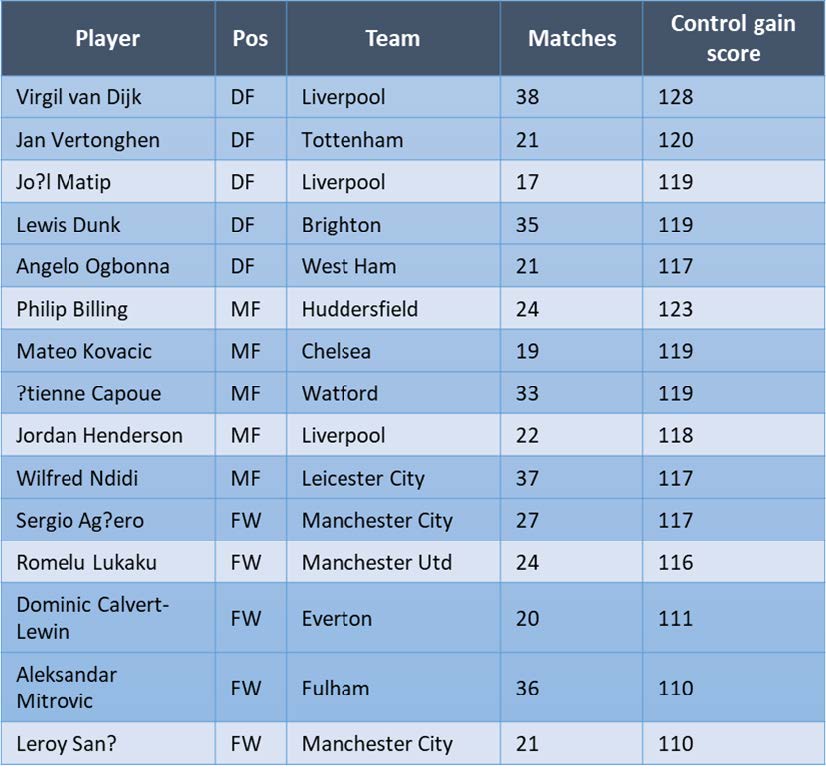
Premier League 2018/2019 control gain leaders:
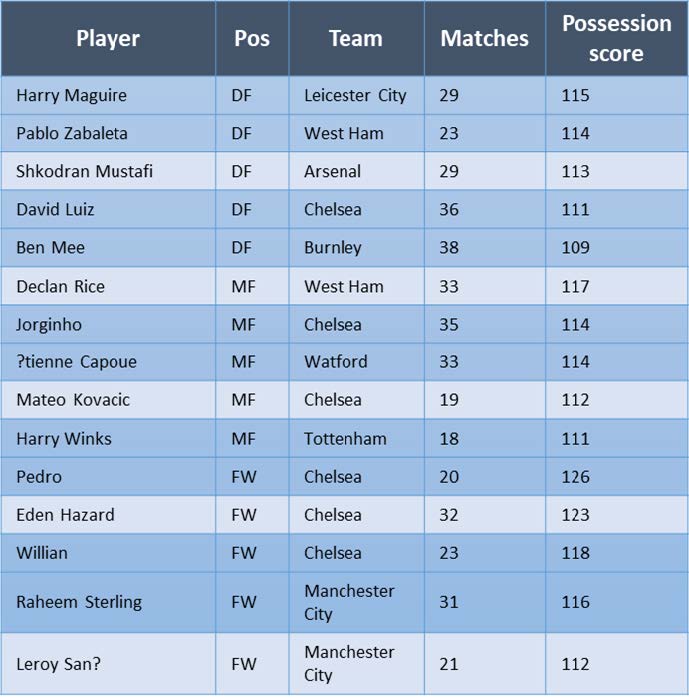
Premier League 2018/2019 ball control leaders:
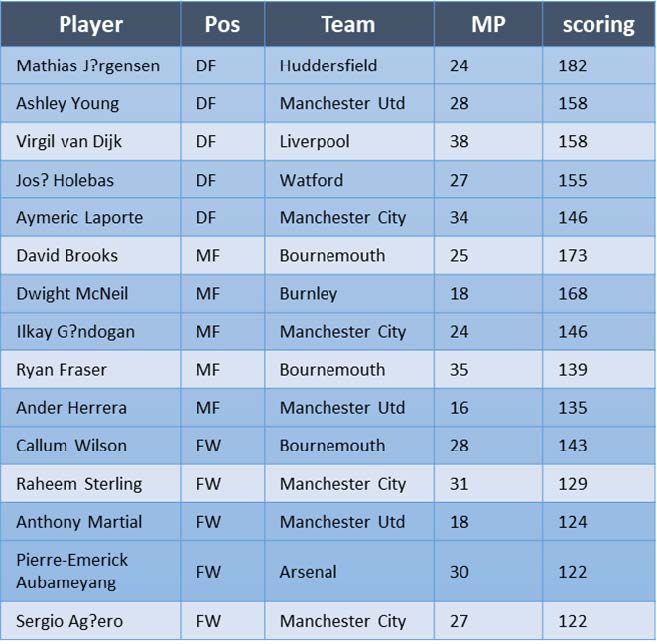
Premier League 2018/2019 scoring leaders:
In order to directly compare players, a radar plot of all the metrics used to compute such scores gives a more efficient view of the strengths and weaknesses of each player. For example, Virgil Van Dijk, playing for Liverpool, was in the top 5 defenders in ball gain and scoring. How would he compare to a defender like Harry Maguire who was the best in terms of maintaining possession?
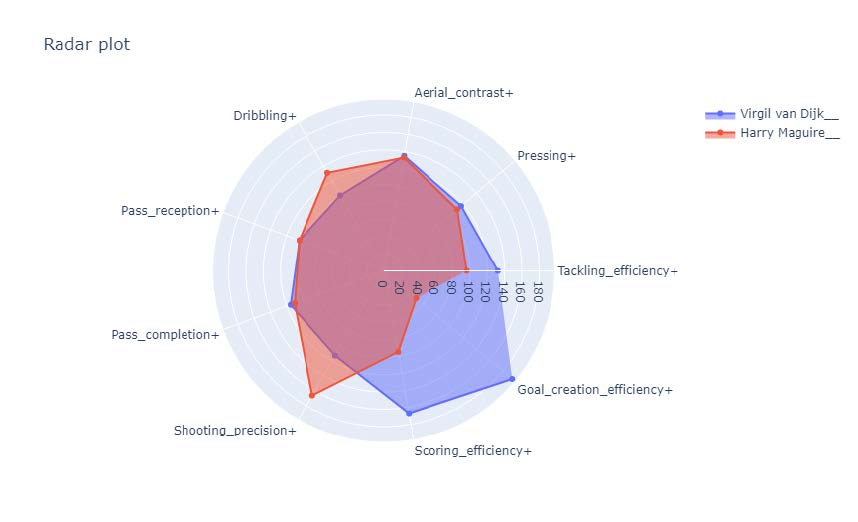
It looks like Maguire was above average in terms of dribbling, clearly above Van Dijk, but the two were very similar in terms of receiving and making passes. So, while Maguire got the edge for possession and shooting on target (shooting precision), Liverpool’s Van Dijk was way more efficient on the scoring side, scoring more goals per shot on average (scoring efficiency) and creating relatively more goal-scoring actions than the average defender, categories in which Maguire was actually below average.
Last but not least, Van Dijk was better at taking the ball back from the opponent (just slightly when pressing, by a lot when tackling).
The radar plot shows the strengths and weaknesses of the two players. Looking at the area covered, Van Dijk was clearly the more efficient contributor overall to his team.
A similar exercise can be done for other roles. For example, Sergio Aguero’s name pops up in the top 5 scorers and ball winners whereas Leroy Sané, playing for the same team, shows up in the top 5 ball winners and controllers:
The comparison is much closer in this case. The two are virtually equivalent when it comes to dribbling past the opponent, however, Sané was better at controlling passes directed at him, shooting on target and pressing the opponent. On the other hand, Aguero was a lot better on aerial contrasts, tackling, scoring and creating goal actions in general as well as being a slightly more efficient passer.
Conclusion
The article tries to formalize player evaluation based on event-based data. There are some limitations to this approach.
First of all, a player might not be attempting certain actions due to the coach’s strategy. This would be the case for a defender in charge of winning the ball back vs. one that is tasked with building the play from behind or a play-making forward vs. a typical number 9 who is expected to be the main scorer.
Furthermore, the data in fbref does not distinguish between different roles on the same line, e.g. a wing back is likely expected to move the ball a lot more than a center back who is probably tasked with stopping opponents getting closer to the penalty area.
Finally, a player playing in a good team might look better because the rest of the team serve better balls (improving scoring efficiency) or lose less balls (less ball recovering events).
These would be valid points and, given more advanced data, they could be addressed in a separate post. However, the goal of this one is establishing a baseline that could be implemented across different leagues. While the focus here has been on the English Premier League, the same analysis could be done for players in the second or third league as the stats used here could be gathered cheaply at any level (like baseball’s score sheets can be collected in any league anywhere in the world). Data on a player’s movement and interaction likely requires more expensive technology for automatic capture and would be unaffordable for a second division or semi-pro team.
Finally, the type of advanced stats developed here should be simple enough for the layman, so that even the least data literate fans can appreciate the analytical verdict on who is the best player for a specific task on the pitch.