Deconstructing a Winning Season
June 13, 2023
Share via

Part I: Data science for football games

Football seems like a simple game: two teams try to put the ball in the opponent’s goal. The ball cannot be controlled with the arms and should stay within the limits of the pitch. Violence is discouraged by a system of sanctions like free/penalty kicks and yellow and red cards. If you score more than your opponent, you win the game. However, beneath this simple appearance, lies complexity. Sure, a player scoring a lot is valuable. But, a player that does not score can be valuable as well by preventing the other team from scoring or by helping teammates to score. 

A player that regains control of the ball robs the other team of a scoring chance. However, at the end of a game, only the scorers are written down and most people can only measure the rest of the team’s contribution based on their knowledge of the game and perception. Is it possible to give a more rigorous evaluation of a team’s performance? 

In this day and age, there is data on everything and, particularly in American team sports, analytics have formalized player evaluation as well as unlocking previously unknown potential, challenging popular beliefs and ultimately modernizing the game. While professional football teams rely on data to evaluate their players, the public still evaluates players and teams based on perception. Analytics are missing from common football discussions.

This article tries to take a step in a modern direction, analyzing data in order to determine what winning teams do over the course of a season. The goal is to find the keys to winning consistently by gathering a few metrics that will allow us to measure a single player’s contribution and, ultimately, make a rigorous player evaluation.

The analysis presented is based on data from the 2017/2018 and 2018/2019 Premier League seasons (the last 2 before the covid pandemic) extracted from https://fbref.com/en/.

Level 0 stats

Scoring more goals than the opponent is crucial to winning a game. In regular league play, a team is awarded  3 points for a win, 1 for a draw and 0 for a loss. At the end of a season, the team with the most points wins the title.

Scoring and not conceding goals are key aspects of winning games, so much so that a regular league table will report points, goals scored, and goals conceded as key performance indicators. While watching a game however, besides the score, the average football fan will occasionally be shown possession percentages, shots and shots on target. These are the level 0 stats used when trying to assess performance.

In assessing the importance of these level 0 stats, we can look at how they correlate to a team’s final ranking. However, it makes sense to adjust these metrics by possession: a team cannot shoot and, much less, score unless it controls the ball at that time (own goals are rare). Plotting possession percentages vs team rank over 2 seasons:

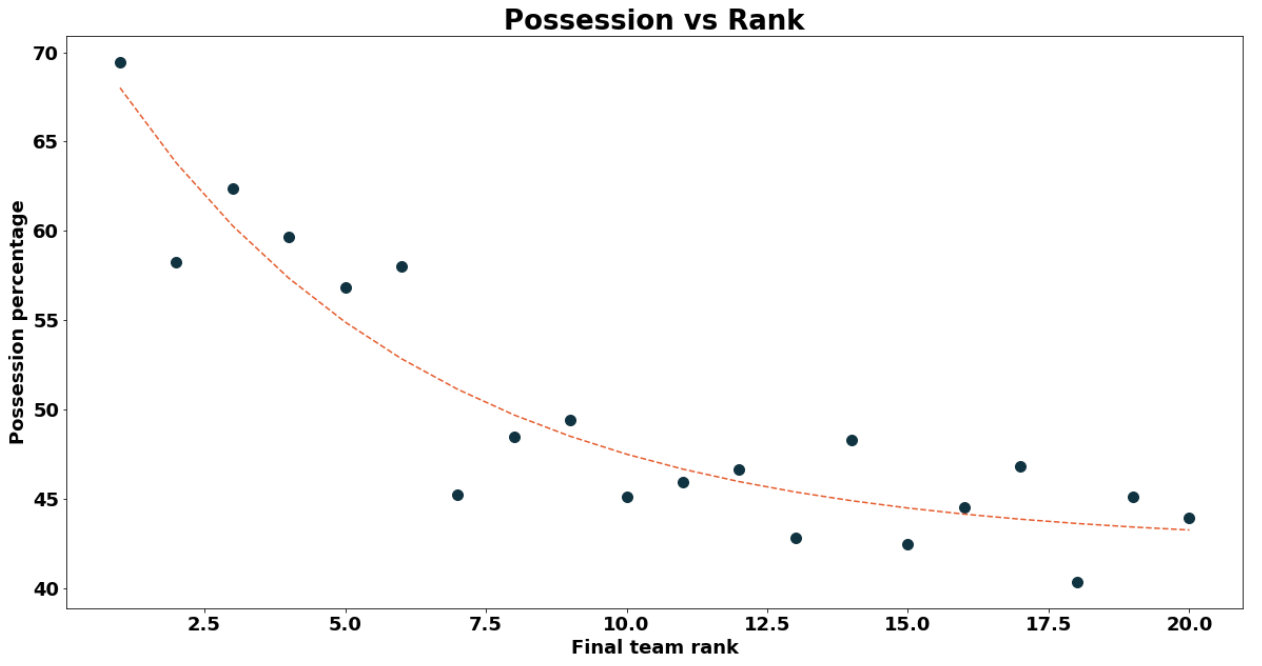
This definitely shows a trend where the top 6 teams control the ball for more than half the game time.

The following adjustments will then be performed on the level 0 stats:

				
					adjusted min < ACTION > = minutes played * possession * . 9 / < ACTION COUNT >


And so on:

StatDescriptionDerived
ShotsNumber of times a team shot the ball towards the opponent’s goalAdjusted minutes to shoot
Shots on targetNumber of shots that were actually at the goal (regardless of whether they became a goal or not)Adjusted minutes to shoot on target
Goals per shotRatio of goals to shots
Goals per shot on targetRatio of goals per shots on target
Goals Adjusted minutes to score
Goals conceded Adjusted minutes to concede

First of all, one can look into (the Spearman) correlation between these stats and the final ranking:

{‘possession’: -0.84,
‘minutes to shoot’: 0.50,
‘minutes to shoot on target’: 0.82,
‘minutes to score’: 0.88,
‘minutes to concede’: -0.67,
‘minutes to score-minutes to concede’: 0.89
}

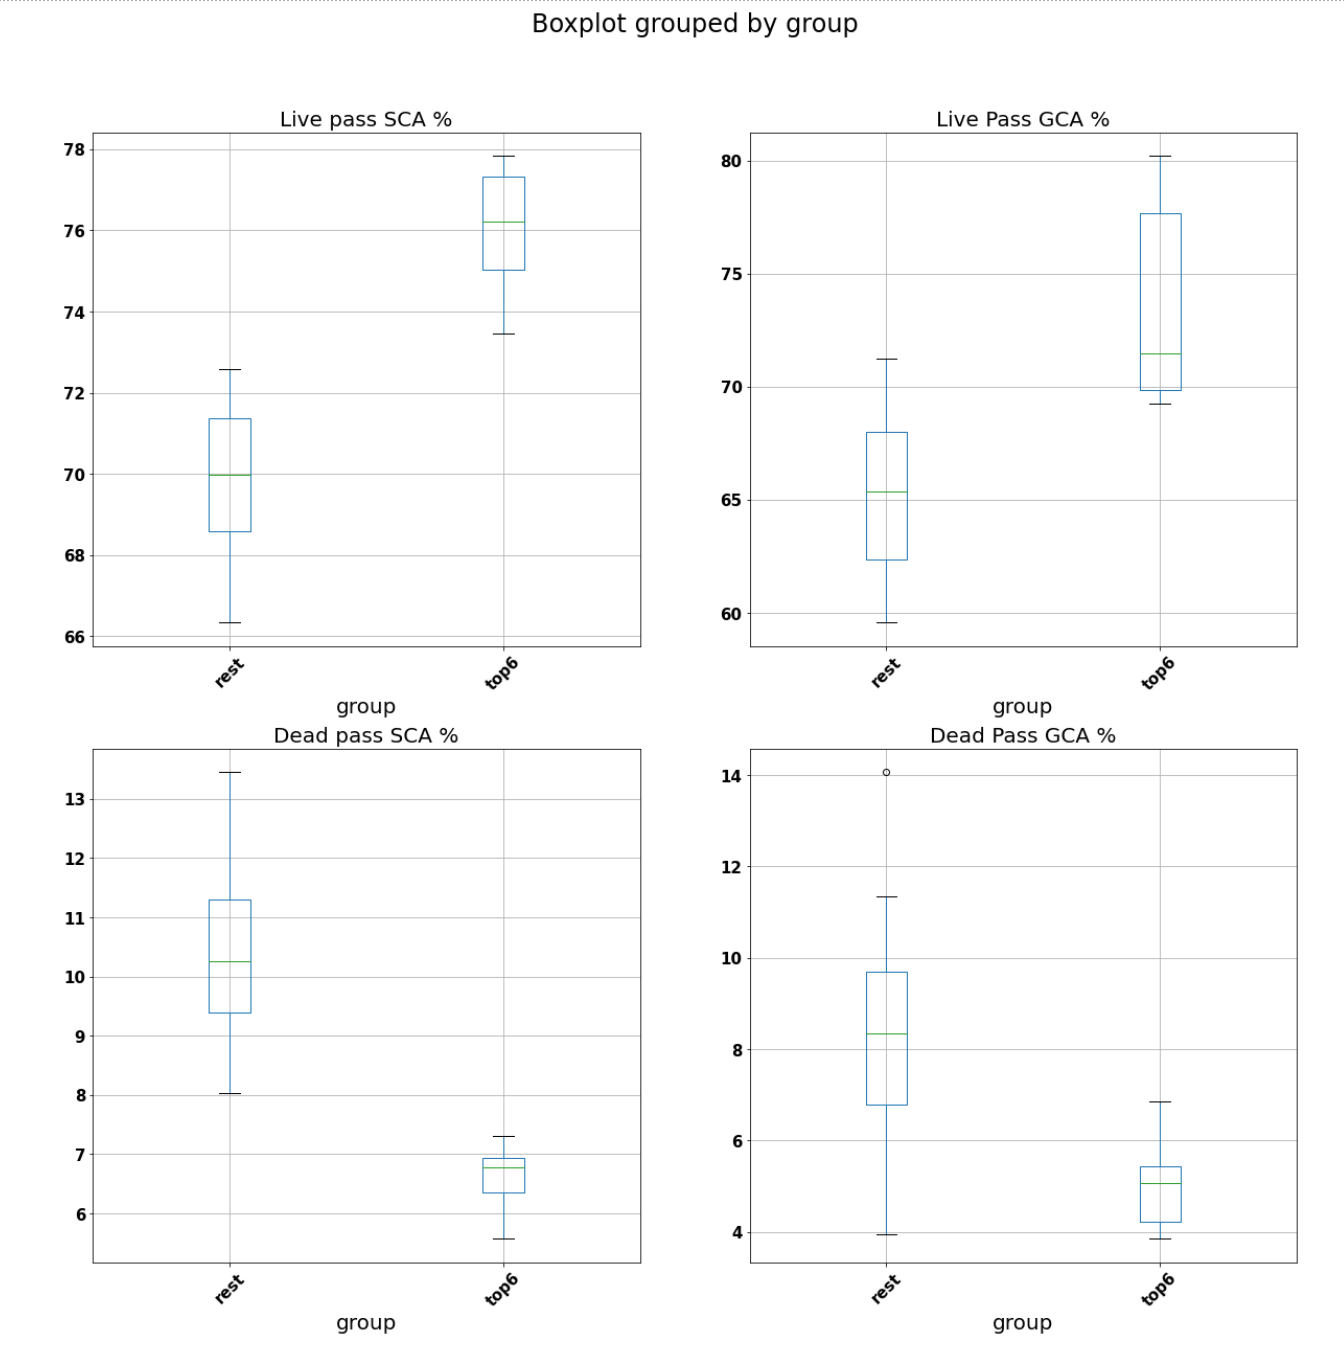
The shooting efficiency (minutes to shoot on target)  and the minutes needed to score are much more tightly linked to the final position. Also, scoring more seems to be more relevant than preventing goals, though the difference in time to score vs. time to concede is the most crucial aspect.

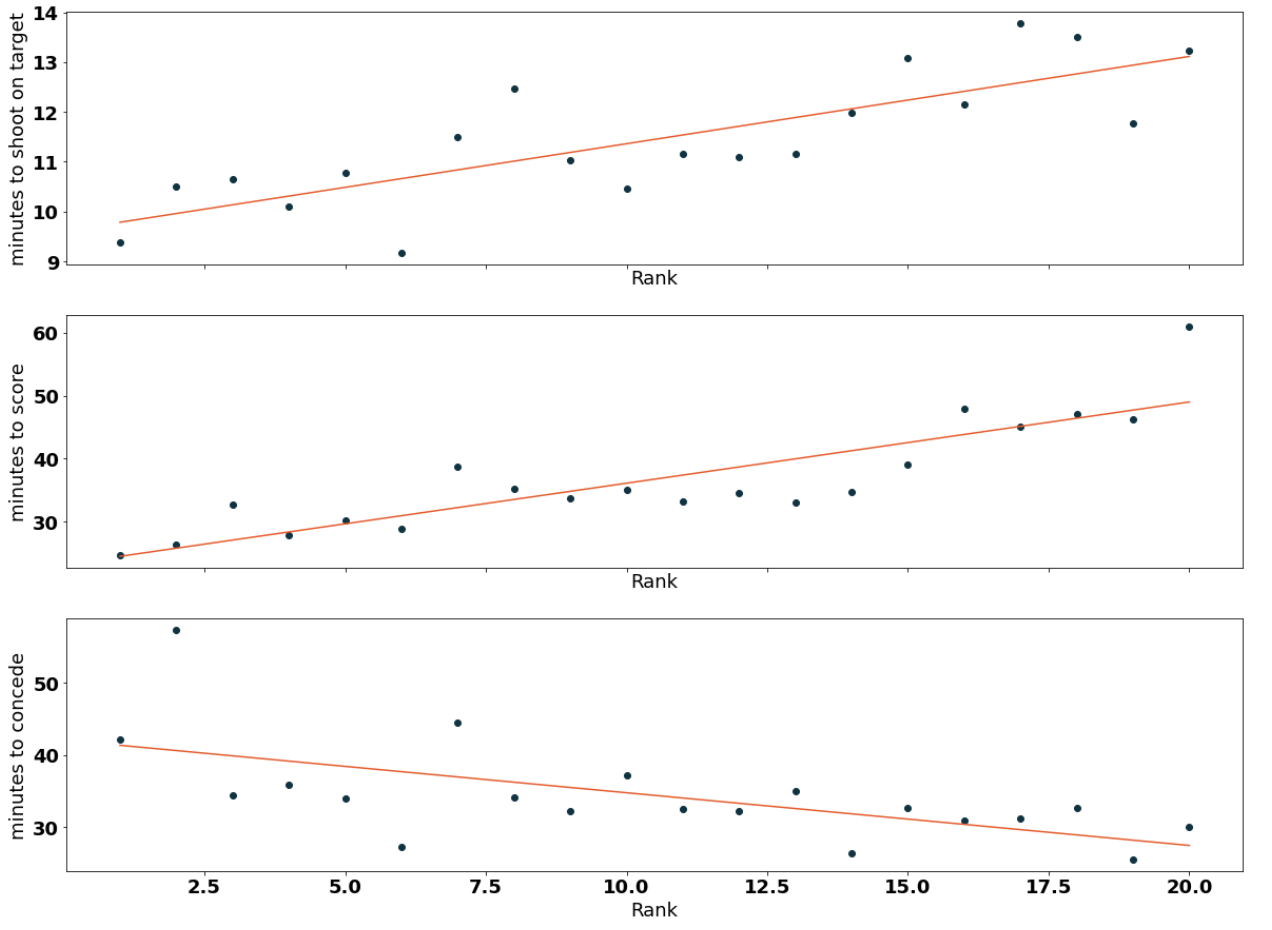
It is interesting to notice how the minutes to shoot are unlikely to be monotonically linked to the final team’s position. The variable is actually rather flat:

Minimum minutes to shoot3’12”
Maximum minutes to shoot3’59”

This means that all teams shoot every 3-4 minutes with a maximum variation of 47s over a season. In comparison, the dispersion to shoot on target:

Minimum minutes to shoot on target9’4”
Maximum minutes to shoot on target13’40”

There’s a difference of 4’36”, a much wider distribution.

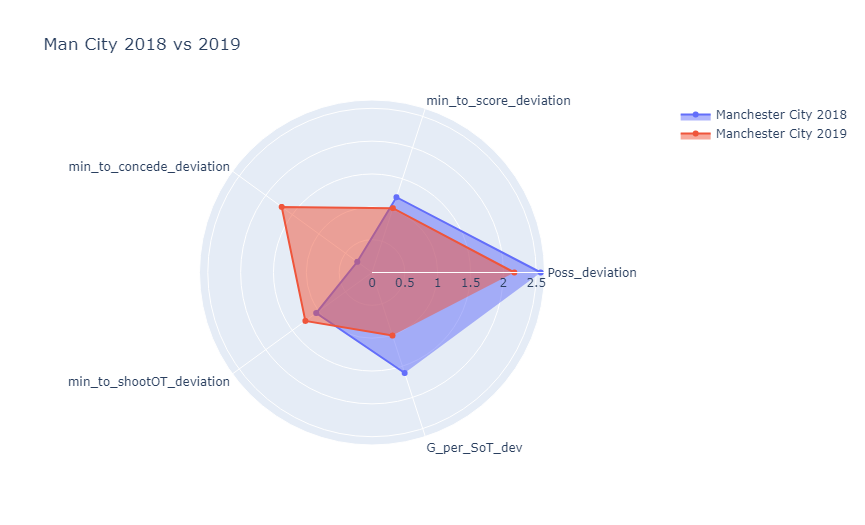
Given these first insights, we can try to compare some teams directly. To simplify the comparison, stats are standardized by subtracting the average and dividing by the standard deviation of each feature so that each feature has an average of 0 and a standard deviation of 1. To avoid confusion, the signs of quantities that are better when they are small (e.g the minutes to score) are reversed so that all quantities are better when positive and worse when negative (a team with a higher minutes to score deviation scores more often than a team with a lower value). Looking at the top 3 teams for the season 2018/2019 (1- Manchester City, 2- Liverpool, 3- Chelsea):

Football & Data Science

Liverpool had the best defense, taking longer than anyone to concede a goal. Compared to Manchester City though, Liverpool took about the same time on average to score a goal, and they were clearly more efficient in scoring whenever they had a shot on target. However, Liverpool were not shooting on target as often as Manchester City and, possibly more importantly, controlled the ball even less than the 3rd place Chelsea. So it seems Liverpool weren’t controlling the ball much and eventually landed in second place thanks to a stellar defense and sniper offense.

Chelsea on the other hand performed worse than the top 2 teams in almost every category, even below the league average in minutes to concede and goals per shot on target, but apparently they had a much higher than average possession rate, controlling the ball more and therefore benefitting from more chances to score for themselves and fewer chances for their opponents.

With a similar visualization, it is possible to look into how Manchester City performed in the 2 years included in the data (the season winner on both occasions):

It seems like the team was quite different in these 2 years: in 2018, Manchester City controlled the ball much better than league average and scored more often and more efficiently. In 2019, the team controlled the ball less compared to league average, though they improved their defense a lot to compensate for the lower scoring efficiency.

Level 1 stats – Possession

Possession allows teams to create more scoring chances while taking chances away from opponents. It’s what allowed Chelsea to finish 3rd overall in 2019 despite subpar performance in other areas. Digging a bit deeper into possession, it is interesting to look into how many touches a team had in a season:

Best teams touch the ball more, which is in line with the possession plot shown earlier. What is now interesting is to see where these touches occur. Looking at deviations from league average is an informative strategy in this case (namely, the difference between touches in a specific third of the pitch and average league touches in that specific third):

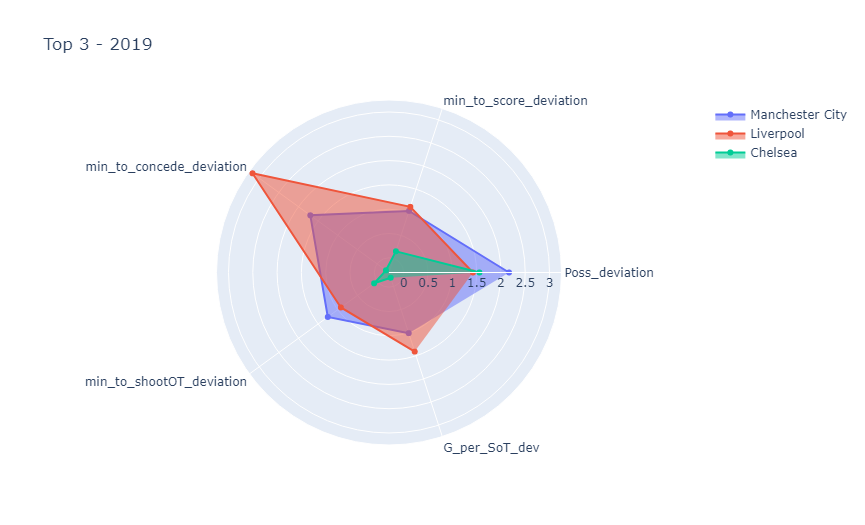
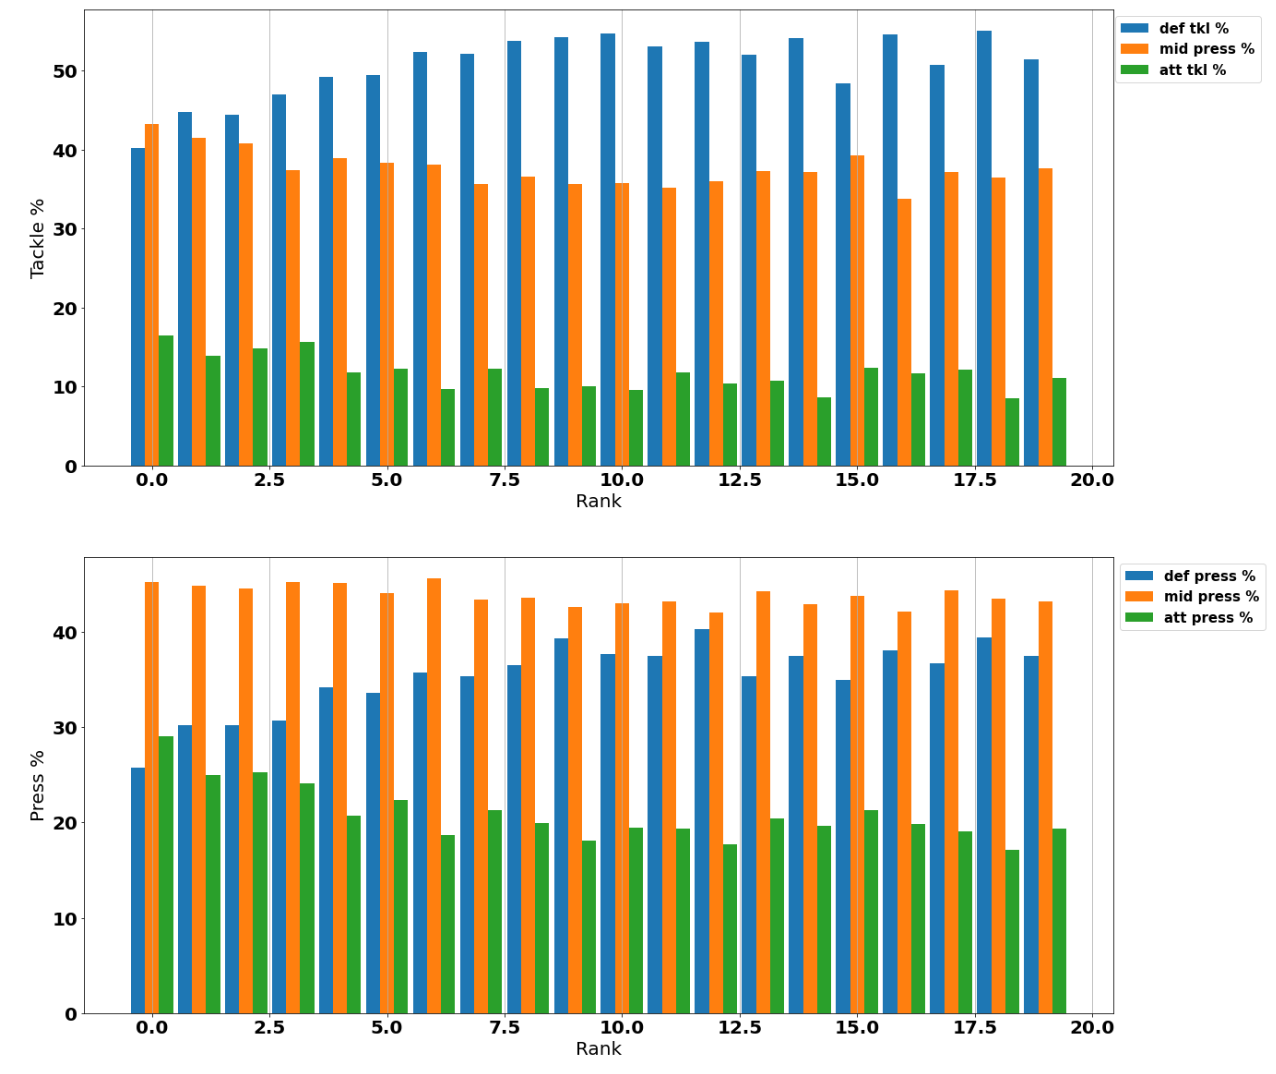
The top teams spend less time defending and more time attacking than the league average. This time is spent mostly in the midfield and attacking third of the pitch. Going down the table, this tendency reverses, with worse teams being restricted to their own half for a larger fraction of the game. This would force a team that does not control the ball much to build longer actions in order to score compared to a team that mostly controls the ball closer to the opponent’s goal.

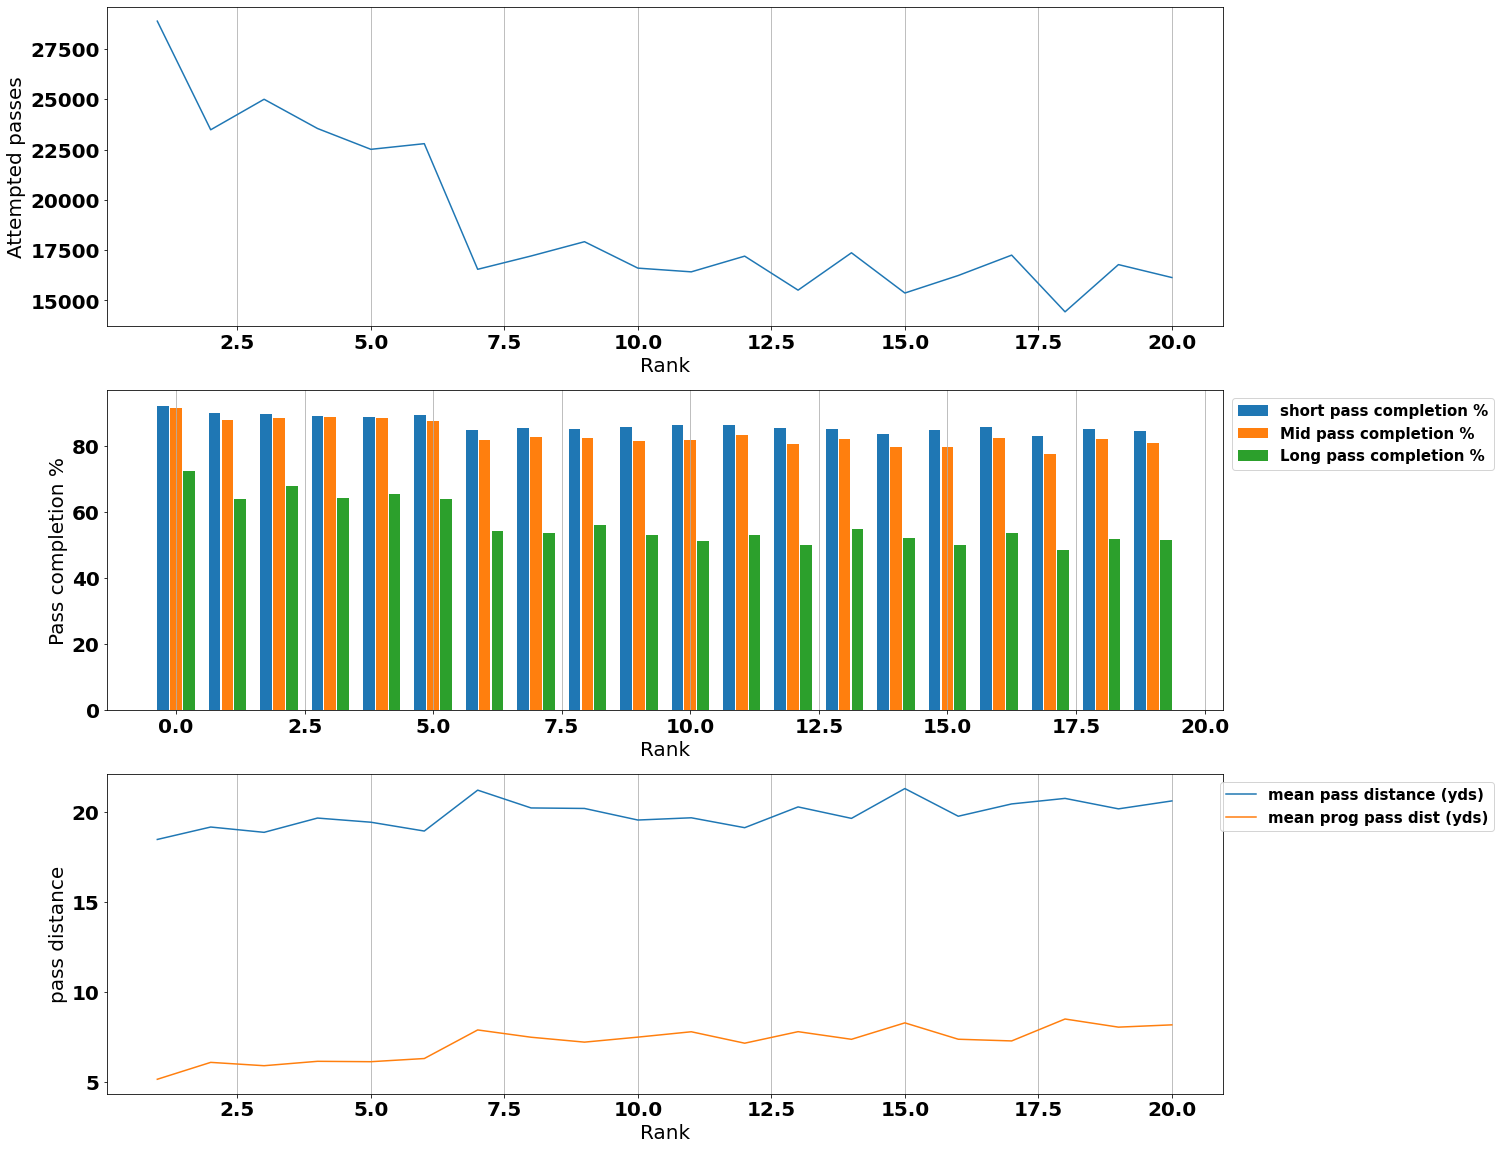
It is however interesting to see a steady statistic across the board:

Minimum average carry distance (yds)4.82
Maximum average carry distance (yds)5.47

Despite most teams carrying the ball for a rather constant amount of distance on average, better teams seem to advance slightly less per carry on average, though more often:

Football & Data Science

This seems to indicate that better teams would rather pass the ball earlier and avoid the risk of losing the ball to an opponent’s tackle, a strategy that seems to pay off considering the average success percentage in receiving passes vs. dribbles:

Football & Data Science

The best teams are more efficient in receiving a pass successfully. The main point however is that teams across the board receive a pass more successfully than dribble at an opponent. Dribbling actually looks rather risky considering the average success percentage is flat around 58%.

Level 1 stats – Passing

Passing seems like the most successful mode of retaining possession. However, strategic components come into play: it is hard to pass the ball when nobody is available for a clean pass. In that case a player may be forced to dribble or attempt a longer or higher pass to avoid the opponents. Looking into how many passes teams attempt confirms however that best teams rely on passes more than their mediocre counterparts:

It is worth noting the strategic component of these plots: best teams are more likely to cover the pitch in such a way that a passing option is more frequently available.

Looking at pass length and average pass distance it looks like the best teams are indeed able to pass the ball more frequently over shorter distances. Across the board however short passes (under 15 yds – second plot) are completed more than 80% of the time. The percentage drops slightly for passes between 15 and 30 yds, though still close to 80% across the board. When it comes to long passes however (longer than 30 yds), completion percentage drops markedly to more or less 60%, at which point dribbling does not look so risky anymore. So, while passing looks relatively safe, a sound strategy, giving passing options to ball carriers is needed to avoid the necessity of hail mary passes which are technically more difficult and less successful overall.

Looking deeper into passing types:

All teams rely very little on dead passes, but it is interesting to see (first plot) that worse teams use passes from dead balls around 3% more often than the top 6 teams. Similarly (second plot) the top 6 teams are pressed into passing the ball around 4% less often. Finally, most passes stay on the ground, but worse teams increasingly relied on low (off the ground but below shoulder level) and high passes, possibly due to the unavailability of potential pass receivers. To highlight why lifting the ball would be a risky strategy:

Winning control of a ball in the air is a game of chance, with the league average being rather flat around 50%, so low and ground passes definitely look like the safer bet for a team that can afford them via superior tactics.

Level 1 stats – Defense

Defense is also a part of winning games. Especially for teams like 2019 Liverpool where the defense was exceptional compared to the rest of the league to the point of compensating for other aspects of the game. Taking scoring chances away from opponents is as important as scoring.

Defense is all about recovering ball possession, so we need to start by looking at how many tackles and pressures were attempted by the top teams vs. the rest as well as how successful the actions were:

Interestingly, the best 6 teams in the league have not tackled the opponents as often as the others, however they were a bit more efficient when doing it. It is also interesting to notice how tackling and more so pressing the opponents are not so efficient when trying to regain control of the ball. Compared with the 80+% passing efficiency, it seems like a hard task to get the ball once it’s lost and passing it around once again looks like a good strategy to keep control.

Digging a little deeper still though, looking into where the tackles and pressures mostly occur:

Best teams look to tackle the opponents less in their defensive 3rd and a bit more in their attacking and mid 3rds compared to lower ranked teams. Similarly, the best teams press high (more on their attacking 3rd) and less in their defensive 3rd compared to mediocre counterparts. In the midfield, pressures are rather balanced across the board, possibly because most of the game will happen in the mid third on average. This lack of balance is reflected in goalkeeper performance:

It seems like the goalkeepers in the best teams are not taking as many shots as teams in the bottom of the board, hence they don’t save as many balls. However, when they do have to work, they are clearly more efficient in saving shots on target. This is reflected in the amount of clean sheets, which may be unnecessary to win a game, but they do show that it is harder to score in general against a top team.

Level 1 stats – Goal and shot creation

In order to win games, a team must score. Looking into data about shot and goal creating actions (the last 2 passes leading to a shot or a goal):

Live passes are the absolutely preferred way to generate shots and goals. However, the top 6 teams tend to rely on live passes quite a bit more than the rest of the league. Dead passes are instead rather rare, but it seems like the top 6 teams rely on those less than the rest of the league in order to score.

On the other hand, solitary actions do not seem to pay off too often as shots and goals created from dribblings are, respectively, 6.0 and 6.6% with random fluctuations across the board. Once again this highlights the importance of a solid passing network on the pitch.

Conclusion

Winning teams control the game. Spending more time in the opponent’s half of the pitch, they are able to keep the ball and pass it around more efficiently, preferring shorter, lower passes and carries as they are less likely to be intercepted, blocked or controlled badly. This translates into the ability to create more shooting and, consequently, scoring chances. Regardless of the amount of chances created, some teams are just more efficient at shooting, hitting the target and scoring more often. They do this with a higher overall frequency, often needing less attempts overall to put the ball in the goal.

Since the best teams tend to play in forward positions the most, their defense does not work as hard as that of a team who loses more games. When the defense of the best teams does have to work it is also more efficient at winning back the ball.

These insights should allow us to move in the direction of evaluating single players based on what brings the most benefit to a team and how much more efficient a player is compared to the league average.

Data Science & Football

This article is part of a three-part series that focuses on data science in relation to football.

To learn more about data science in football, you can also read these articles:

Part II: Evaluating Football Players

Part III: Bad Performance of Bad Luck? How Offense and Defense Quality and Uncertainty Impact Outcomes in Football

Details

Title: Deconstructing a Winning Season
Author:
DAIN Studios, Data & AI Strategy Consultancy
Published in ,
Updated on January 16, 2024