Machine learning (ML) is playing an ever-bigger role in everyday life by helping us make decisions – from choosing which movies to watch on Netflix or which news to read on Facebook to potentially life-changing decisions like job and loan applications or healthcare decisions. But can we call these automated decisions made by Artificial Intelligence (AI) systems fair? Can we rely on ML algorithms to decide about loan and job applications, or are they prone to biases that would negatively impact certain groups of people? Unfortunately in recent years, biased decisions made by AI have been ubiquitous: Google’s search engine seems to think the majority CEOs are white males, Amazon’s free delivery appears to be biased against black neighborhoods in US cities and its hiring model was biased against women, job adverts have been proven to be shown more to male rather than female advertising consumers.
Such unfairnesses have different causes. Problems can be caused by what an algorithm is trying to optimize for. A certain type of job advert being shown to more men than women can be the result of an algorithm that concentrates on advertising cost-efficiency in an industry that charges more for ad-delivery to younger women than for men. More often, the problem is the data itself – for example, in the past, CEOs were mostly white and male, and such outdated information may still power the latest AI systems. Flawed data produces flawed results, or, as computer scientists like to say: “Garbage in, garbage out.” But how can we decide if a system is unfair or not? What can a company do to avoid negative news headlines like those above?
How to measure fairness in the context of decision-making?
Fairness in the context of decision-making “is the absence of any prejudice or favoritism toward an individual or group based on their inherent or acquired characteristics,” as researchers at the University of Southern California’s Information Sciences Institute put it. But how can it be measured? Let’s imagine an ML model that decides about the creditworthiness of individuals applying for a bank loan. Using credit histories, income, age, criminal records etc., it classifies each person as having either good credit (and so likely to pay back a loan) and bad credit (likely to default). We need to take a closer look at the decisions the ML model made – and whether individuals deemed creditworthy actually paid back the loans they were given.
How we assess the fairness classifications in ML models
The so-called German Credit Dataset, for example, contains information about 1000 loan applicants. Each person is classified as good or bad credit risk according to a set of attributes – what they need the loan for, their age, gender, whether they own housing, how much they have saved, etc. Using tools built by DAIN Studios, we can assess the fairness of these classifications in a number of ways. We first choose what data scientists call the “protected variable”, the variable that creates the population set we are interested in. This can be ethnicity, gender, age or income group, etc. – or a combination of these, if we’re interested in, say, how people of a certain age group and ethnicity are treated by the ML model.
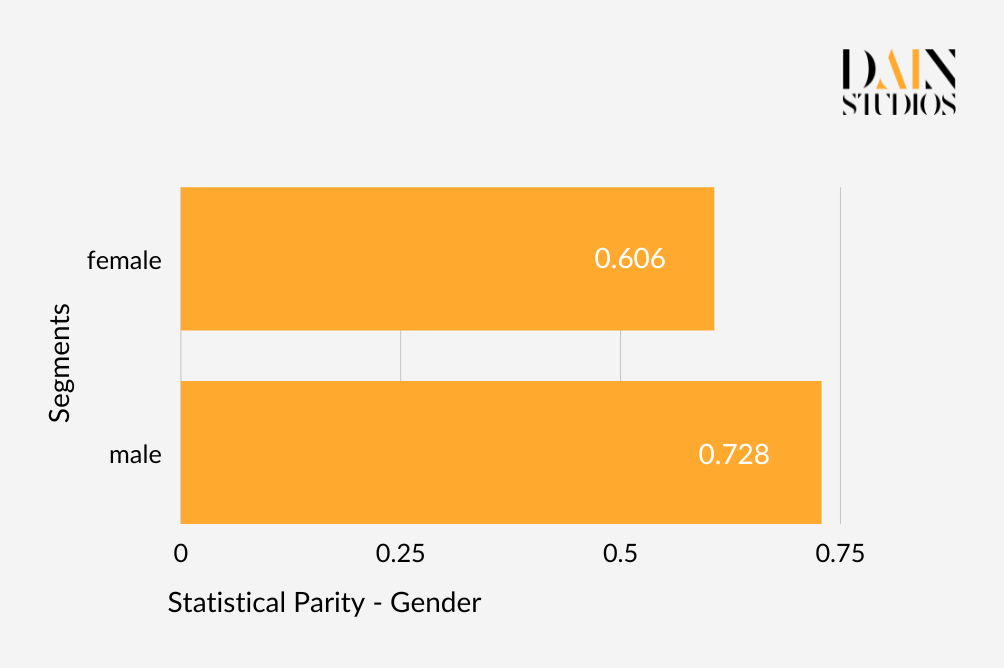
Let’s use gender. One of the most common definitions of fairness is Demographic or Statistical Parity, which in this example would make sure that the outcomes of an algorithm are equal for males and females. This means the German Credit Dataset should have a loan-application acceptance rate that is roughly the same for men and women. In the credit dataset, 73% of males received the loan they applied for, whereas only 61% of women did. Whether we reject the result as unfair depends on how strict we are. One common approach is to allow anything up to a 20 percentage difference between two values to be acceptable. That would in this case allow us to say that the dataset’s ML model satisfies Demographic Parity when it comes to gender.
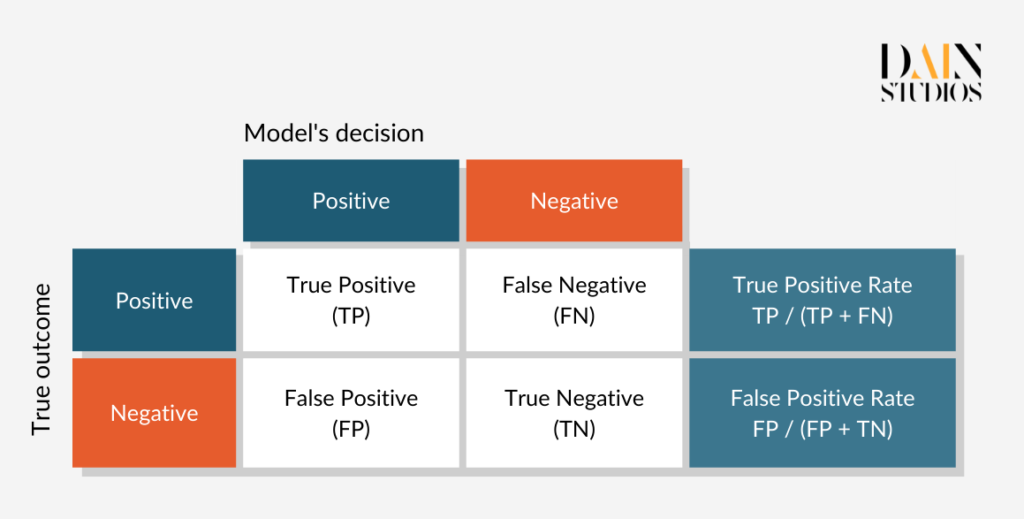
One problem with Demographic Parity is that it can be satisfied in unfair ways. For example, with the help of the model we could scrupulously select the top 80% of male applicants and randomly reject every fifth female. This would make the outcome look fair according to Demographic Parity. An alternative fairness definition is called Equalized Odds, which in this case ensures that all creditworthy applicants have the same chance of getting a loan, regardless of whether they are men or women. This condition is fulfilled if male and female applications have the same proportion of so-called true positives (loans granted to creditworthy borrowers) and false positives (loans granted to risky borrowers).
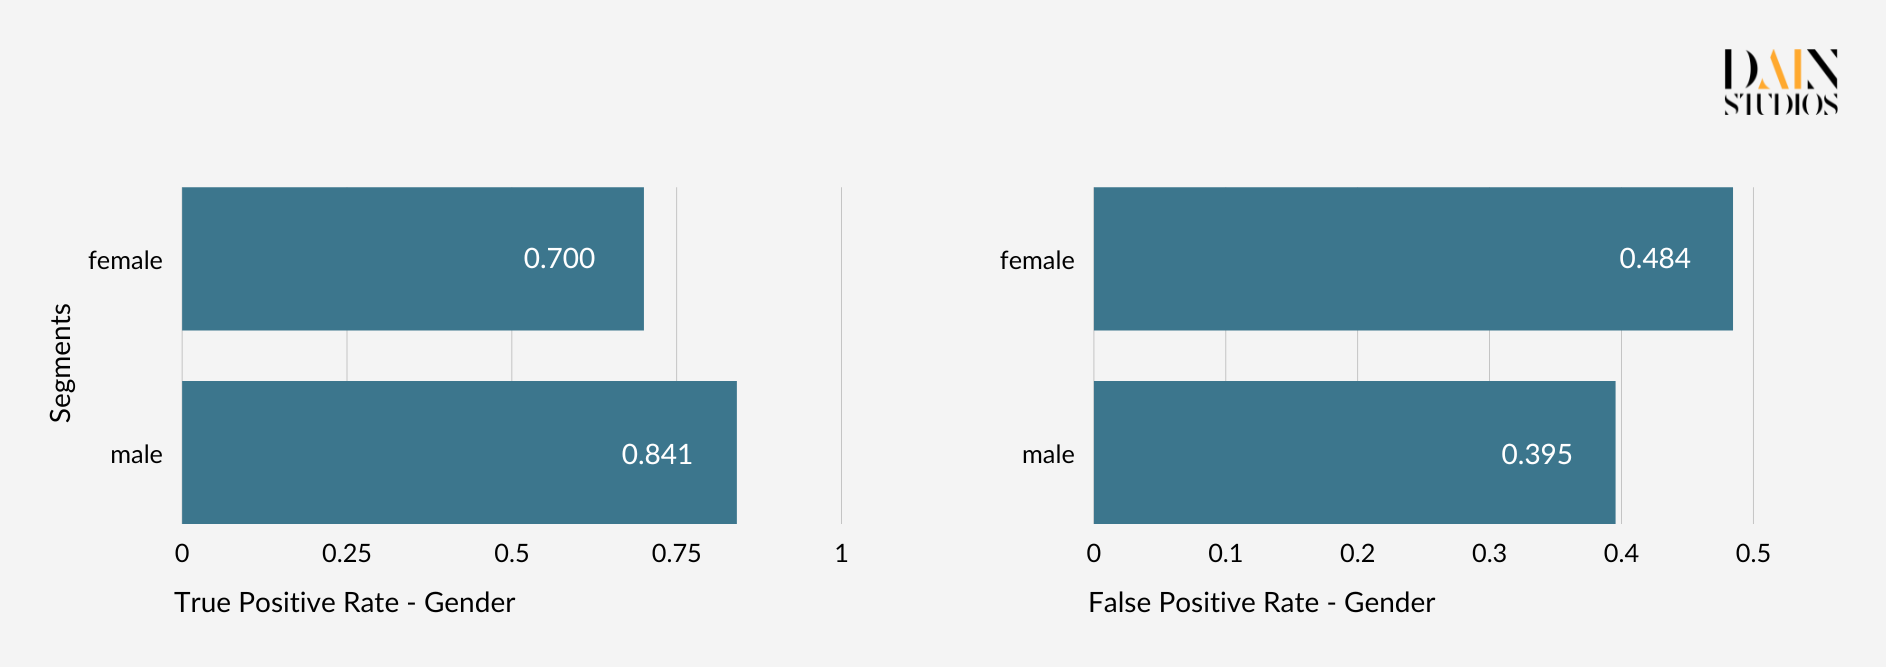
The so-called confusion matrix below helps to make sense of this. Taking data for males and females from our German Credit Dataset, we can determine which proportion of each gender was rightly given a loan (true positives) and which was wrongly given one (false positives). Doing this shows us that if we follow the model’s recommendations, 70% of creditworthy women and 84% of creditworthy men are given loans, while 48 percent of credit-unworthy women and 40% of credit-unworthy men are also able to borrow. Whether the ML model treats men and women the same again depends on how seriously we take the discrepancies displayed by these pairs of error rates.
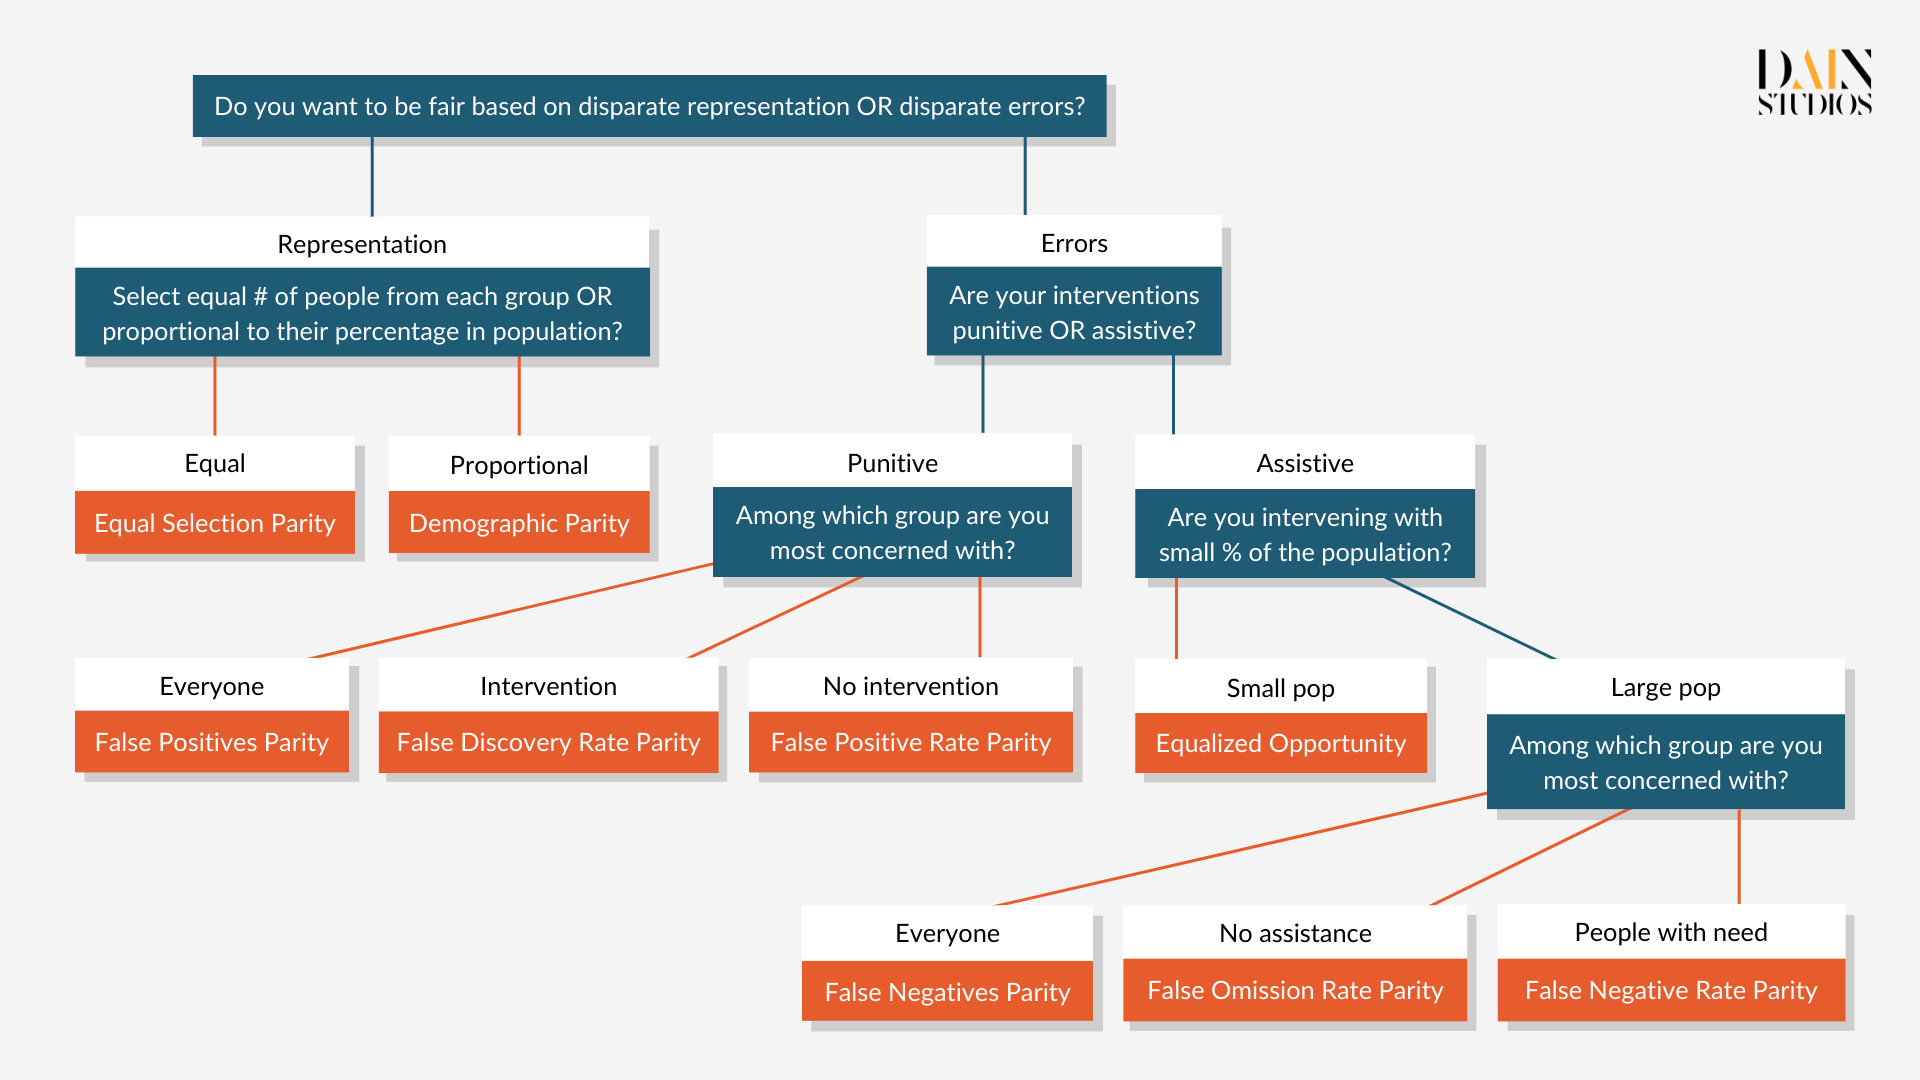
To measure the fairness of AI systems, we need to select a fairness metric depending on our specific use case.
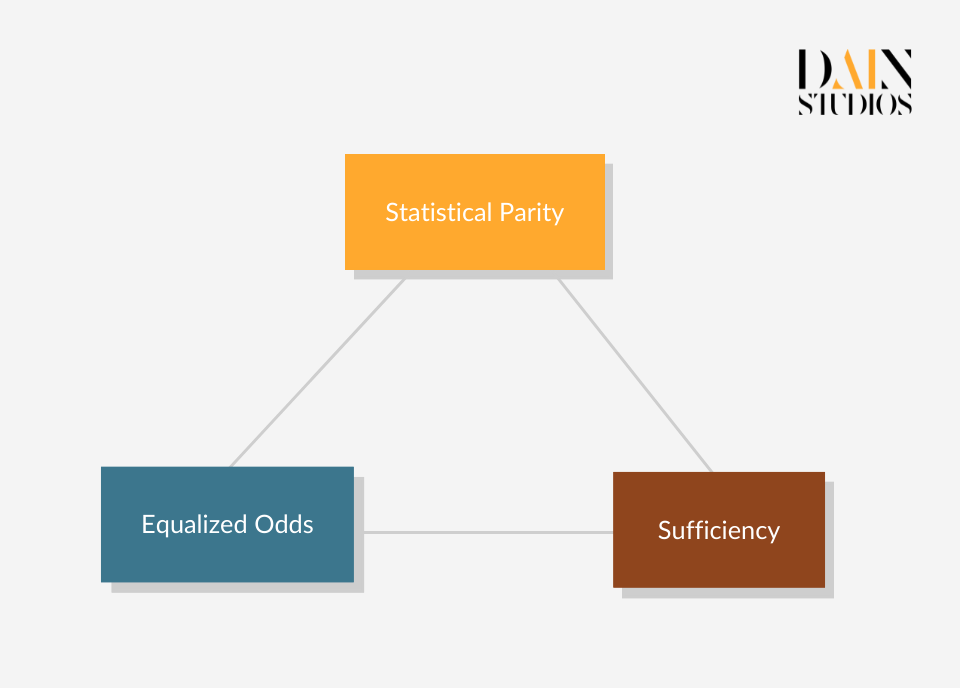
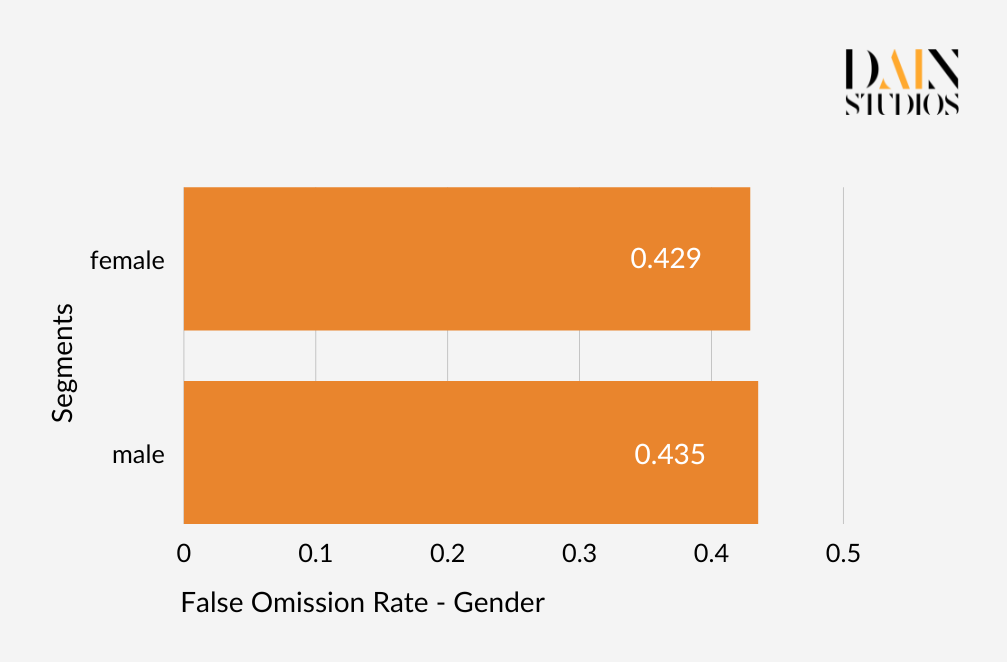
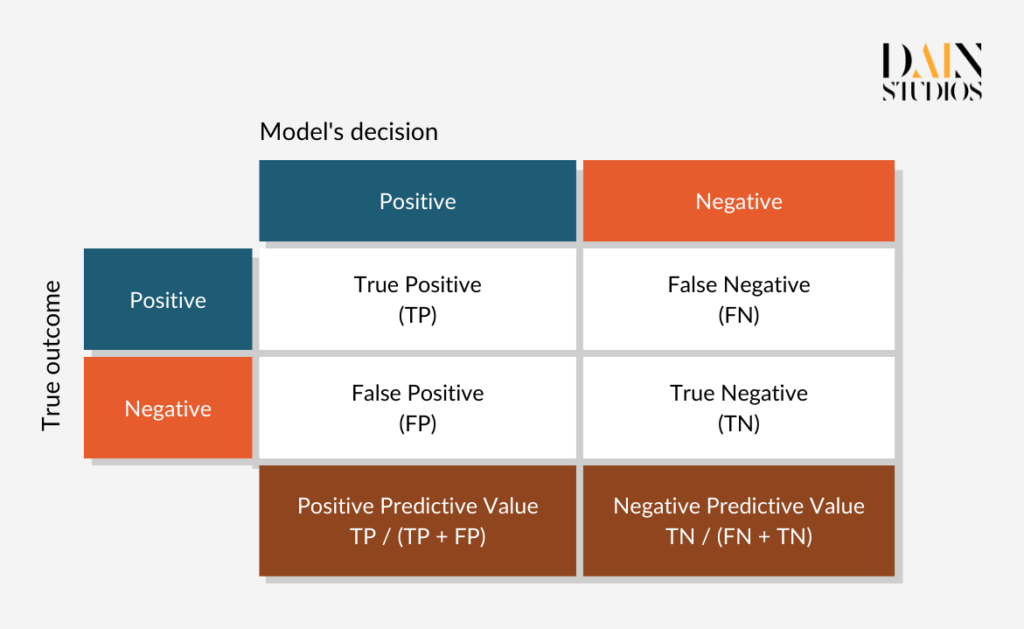
There are many more fairness definitions and metrics, but most draw on the three types described. How can we create algorithms that satisfy them all? Luckily, we don’t have to. The Impossibility Theorem of Fairness states that the three fairness criteria – Independence (aka Demographic Parity), Separation (aka Equalized Odds) and Sufficiency – cannot be all satisfied at the same time. This means we need to make trade-offs when thinking about the fairness of AI systems and we need to select a fairness metric depending on our use case. Equalized Odds, for example, would not be the most suitable metric for studying the fairness of problems where false positives are rare, such as SARS-CoV-2 antigen tests. We should also think about whether the decision the ML model is meant to support is punitive (like determining parole) or supportive (like granting a loan).