Today AI is being used to predict all kinds of events of public interest, such as the outcome of elections, college basketball games and even things like who would die in Game of Thrones. Machine learning algorithms also exist to predict the winners of the Academy Awards and I recently put such a model, one that I have been fine-tuning and running in the past few years, to the test. On March 27th, 2022, the winners of the 94th Academy Awards were announced, so let’s have a deep dive into the results and evaluate the model’s performance.
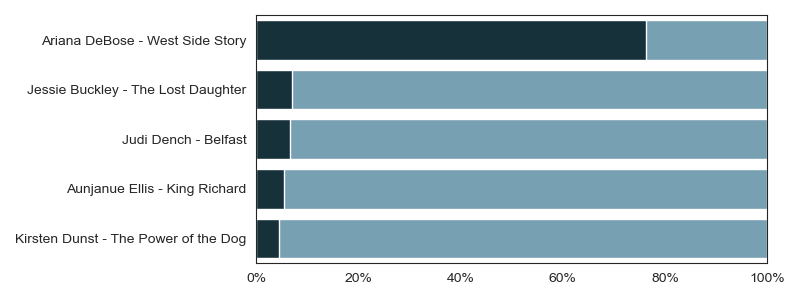
The model can be used to predict the winner of six Academy Award categories: Best Picture, Best Director, Best Actress, Best Actor, Best Supporting Actress and Best Supporting Actor.
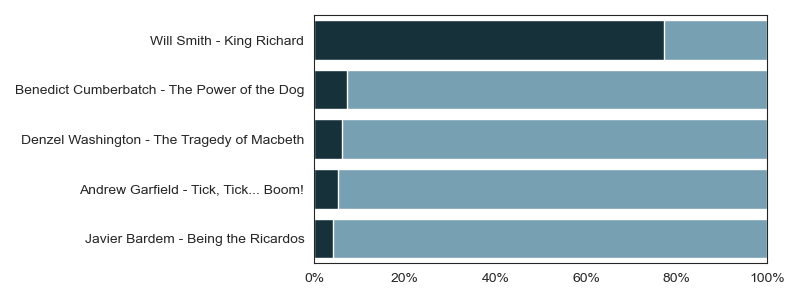
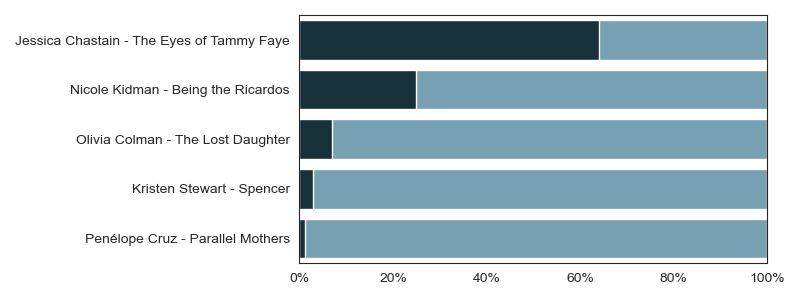
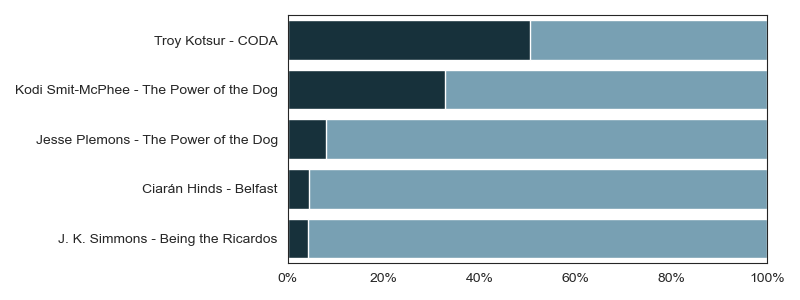
In 2022, it was able to correctly classify five out these six categories, including Will Smith’s win for King Richards.
Oscar predictions 2022
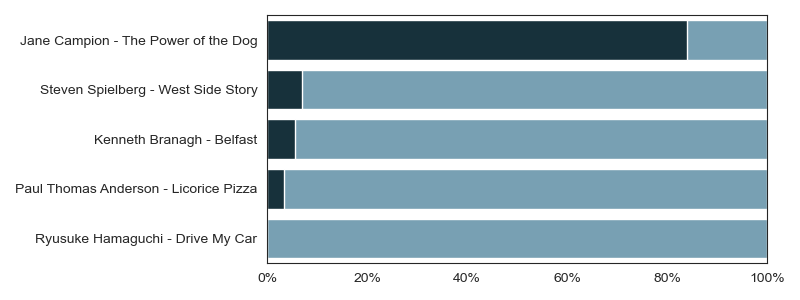
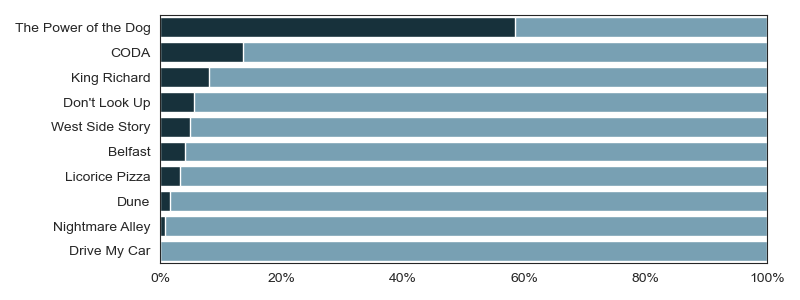
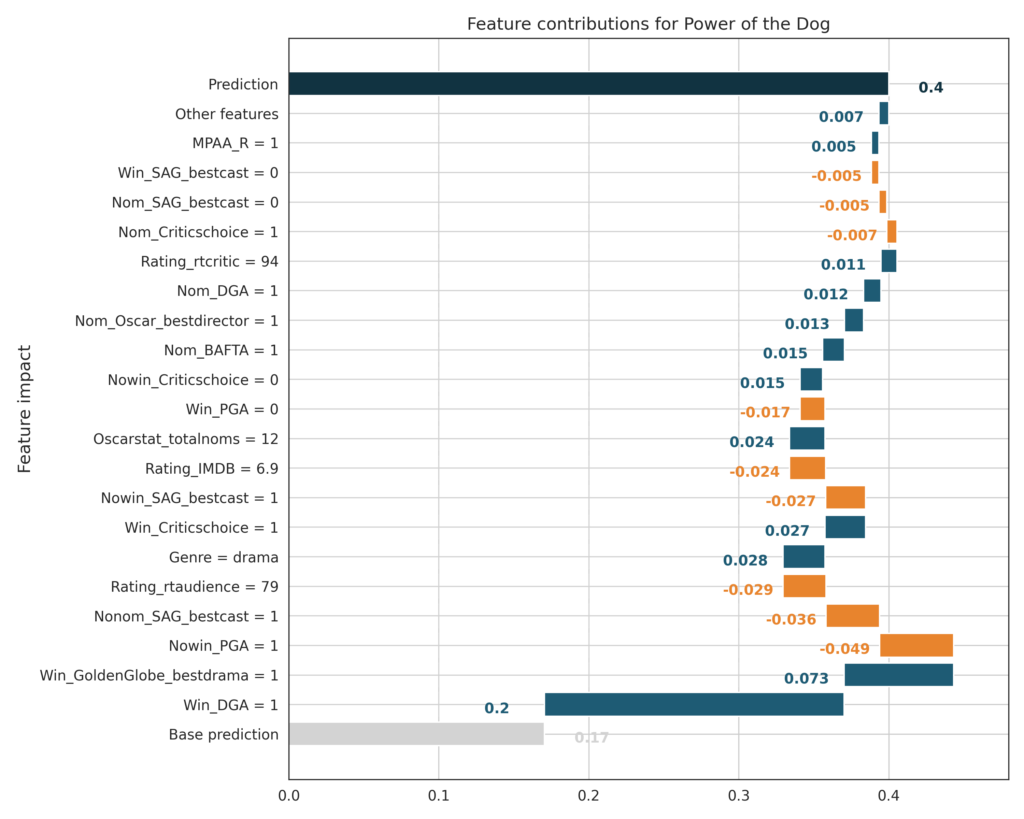
It can be insightful and interesting to focus on the instances that an AI model did not classify correctly. In the case of the 2022 Oscars, this is the Best Picture category, where the model predicted The Power of the Dog to win. In the end it was Apple’s CODA that won the prize for Best Picture.
Explainable AI
In the case of complicated AI models, these types of questions can be hard to answer. Luckily, at DAIN we are experts at explainable AI, which is a family of methods that can make the outcomes of black-box machine learning models understandable to humans. The visualizations to follow are created by DAIN’s own XAI library.
Before we dive into the details, let me discuss the basics about the machine learning model that was used to predict Oscar winners. To train the model, I used IMDB and Rotten Tomatoes to gather information about movies between 1960 and 2022. The features of the model can be grouped into three categories: characteristics of the film itself, Oscar statistics, and the results of other ceremonies of the awards season.
Film characteristics include genre, popular acclaim (as measured by IMDB rating and Rotten Tomatoes’ Audience score), critical acclaim (as measured by Rotten Tomatoes’ Critics score), release quarter and MPAA rating.
I call the second category of features Oscar statistics. These are pieces of information we can gather simply from looking at (historic) nominations. For example, the award for Best Picture is rarely given to a movie whose director was not nominated for Best Director. The last time this happened was with Green Book in 2019, and it only happened three times before that in the history of the Oscars. The opposite relationship is even stronger: the last time Best Director was awarded to the director of a movie without a Best Picture nomination was in 1929. Films with a higher total number of nominations also have a higher chance of winning in the six categories I examined. This year The Power of the Dog had the most nominations (12), followed by 10 nominations for Dune and 7 for Belfast.
The results (and nominations) of other award ceremonies also play an important role. The Academy Awards is the last show of the awards season, and is therefore preceded by similar award ceremonies such as the Golden Globes and the BAFTA, and also by some category specific awards such as the Screen Actors Guild Award. Very often the same movies, directors and actors receive these awards, so the results of these Oscar precursors are very important predictors in the models.
Fundamental XAI plots
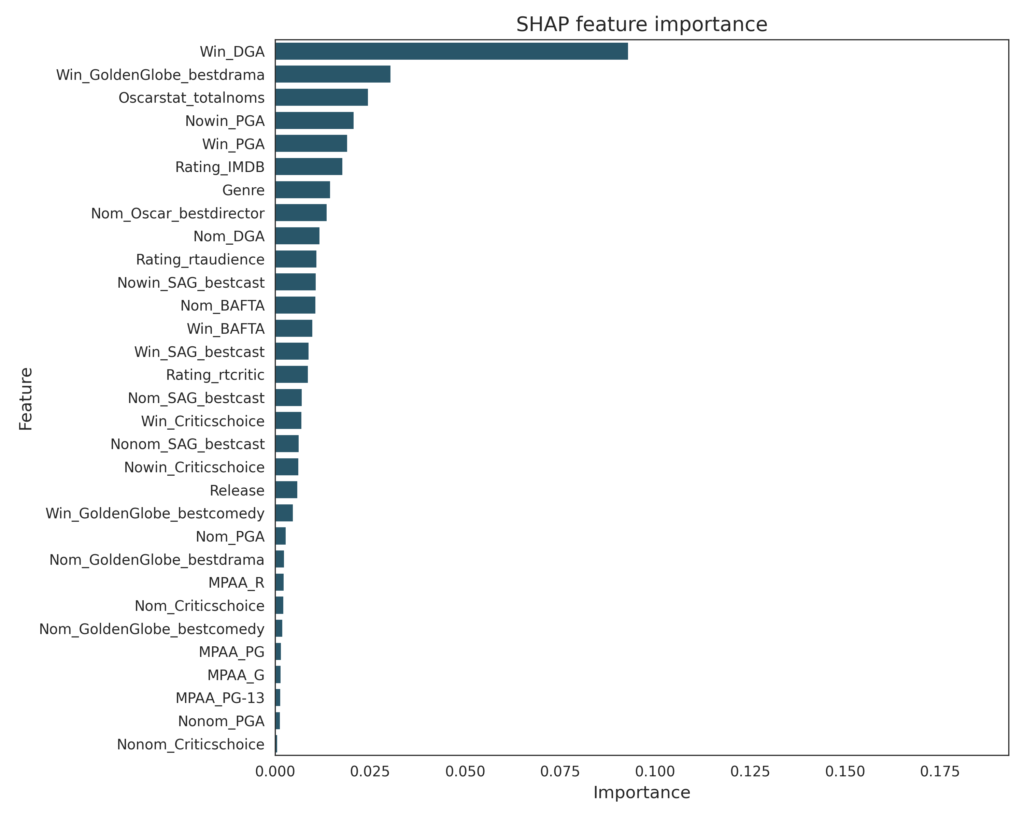
To find out exactly how important each of these variables are, we can take a look at one of the most fundamental XAI plots:the feature importance plot. This plot shows how much each variable contributes to predictions on average. We can see that winning DGA is by far the most important variable. DGA stands for Directors Guild of America, and the DGA Award is given out annually to a director. The second most important feature is the Best Drama category of the Golden Globe awards.
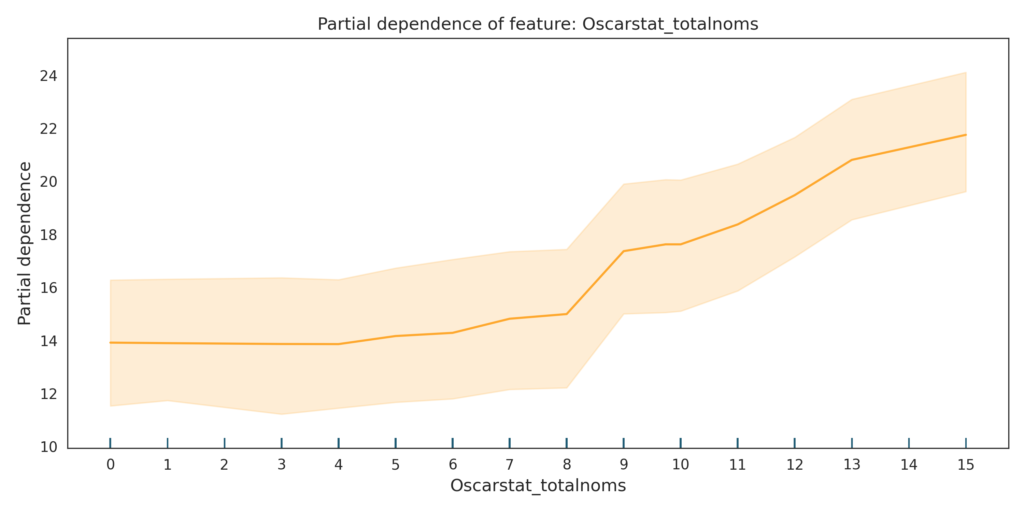
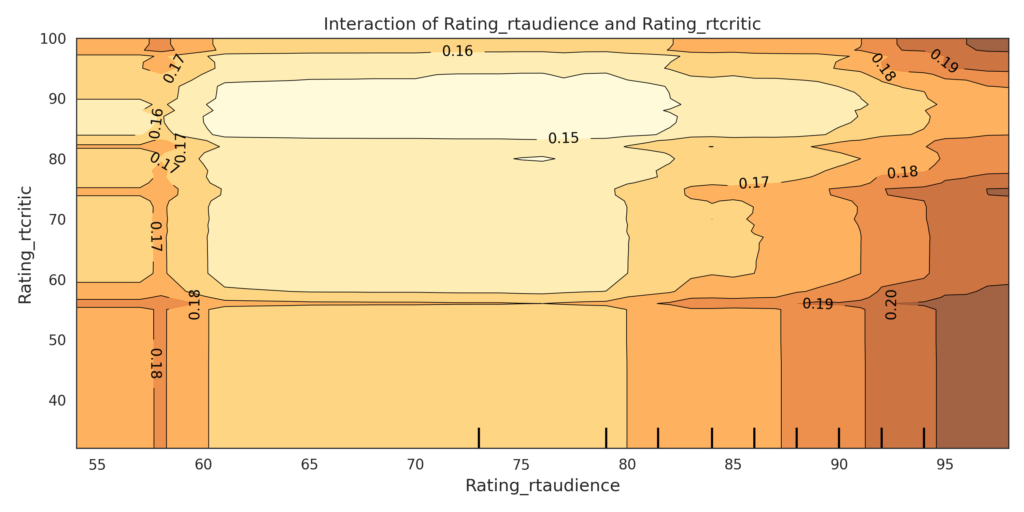
As we can see, the answer is pretty much “the more the better”, but there seems to be a jump in the probability of winning at around 8 predictions. Partial dependence plots can be useful to look at but they can also be unreliable when we are looking at the response of correlated features. For example, movie ratings are correlated. Looking at the partial dependence plot for Rotten Tomatoes audience score and the critics score one-by-one wouldn’t give us the entire story. In this case, it’s better to look at 2D partial dependencies. The next plot shows such a 2D partial dependence plot where the vertical and horizontal axes represent the two Rotten Tomatoes scores and the colors of the plot show the probability of winning given these scores.
What we can read off this plot is that movies with both a very strong audience and critic score, and movies with a lower critics score but a very high audience score have the highest chance of winning a Best Picture Oscar.
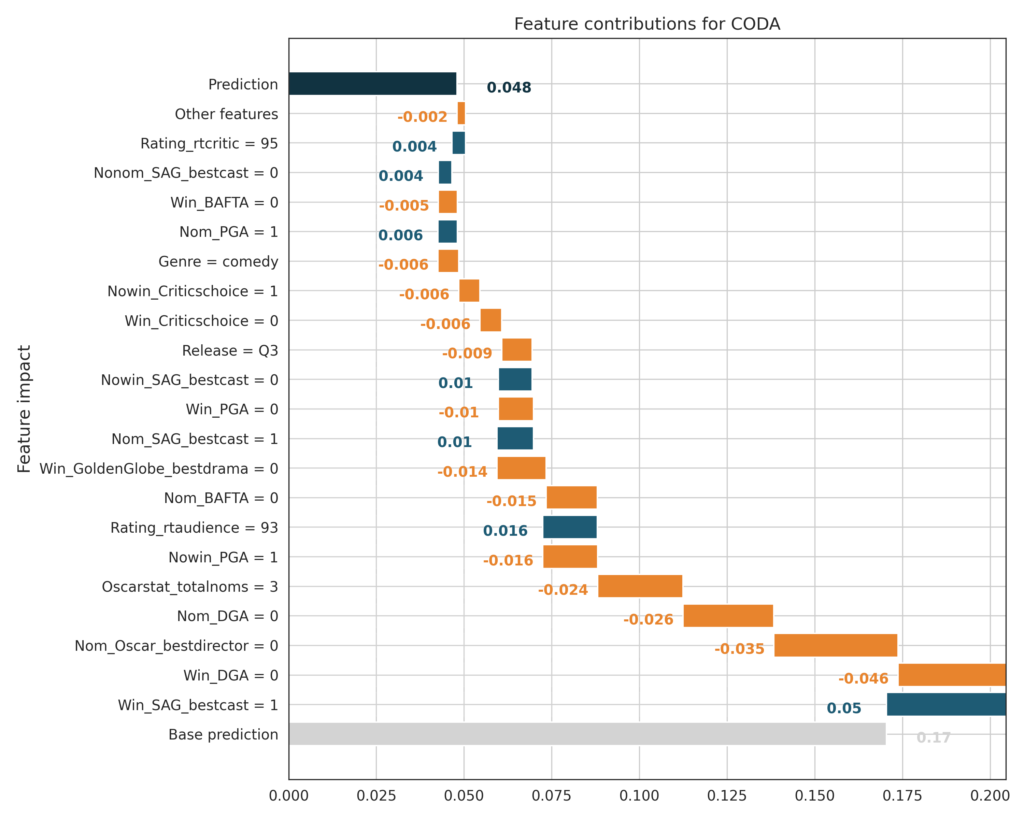
CODA on the other hand, which did not win any major awards besides the SAG Award for Outstanding Performance by a Cast, is a comedy and has much lower Oscar nominations in total than The Power of the Dog. Furthermore, CODA was not nominated for the Best Director award. As mentioned previously the link between a Best Picture win and a Best Director nomination is a very strong signal in the data – 2022 is only the fifth time this exception ever occurs in the history of the Oscars.
After looking at all the model interpretability plots and being able to look into individual predictions we now have a better understanding of how our model is making predictions and what we need to look out for in the future. Hopefully, we also have a better understanding of the factors that influence a film’s chances of winning an Academy Award.