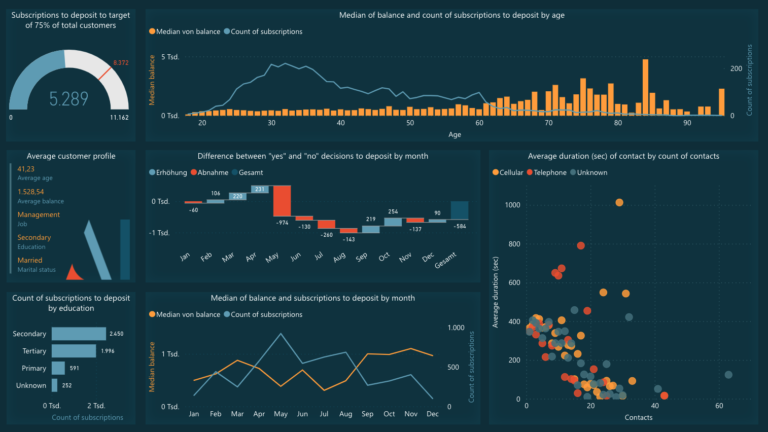
This dashboard contains survey data on customer preferences and opinions on a fictive fast food restaurant chain in Germany on November 2022. Conducting surveys to know more about customers, their opinions, behaviour and preferences can help determine factors that can maximize their experience, satisfaction and improve the business.
The dashboard incorporates diverse visualizations designed to facilitate cross-filtering and cross-highlighting techniques. These features enable users to delve deeper into the data, explore relationships between different fields, and identify influential factors that impact key business aspects.